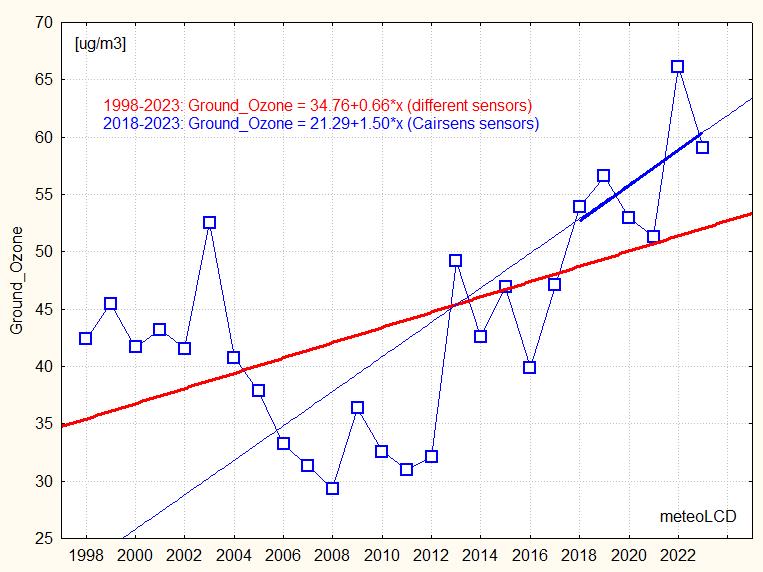
("bad ozone")
Mean +/- stdev of 2023: 59.0 +/- 30.5 ug/m3
Mean
+/- stdev (from yearly means)
1998 to 2022:
43.7 +/- 9.6 ug/m3
2002 to 2022: 43.8 +/- 10.4
2018 to 2023: 56.7 +/- 5.4
Trends 1998 - 2023: be careful: API400 values may be too low!
2018 -
2022: Cairsens sensors; 2022 value seems too high.
Please note the succession of 3 different instruments
2002 - 2004: O341M (Environnement SA)
2005 - 2014: API400 (Teledyne)
2015 - 2017: O341M
2018 - 2023: Cairsens O3&NO2 (Envea). The sensor is
replaced every year by a new one.
As NO2 values are below the minimum of this
instrument, readings can be taken as O3 only (in ambient air: no correction
for temperature and pressure!).
The official Beckerich station data are used for calibrating the Cairsens readings
(from time to time).
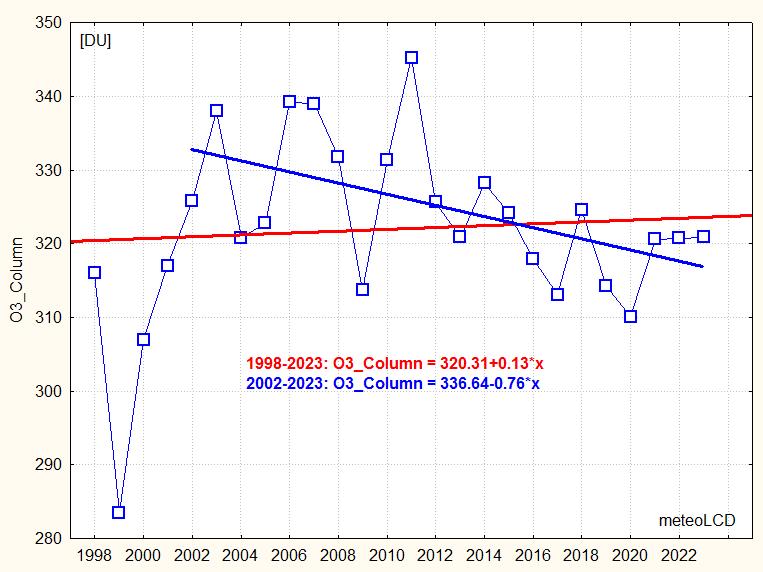
("good ozone")
Mean and stdev of the year 2023: 320.9 +/- 40.1 DU (169 days)
minimum : 225.6 (13 Feb )
maximum: 465.2 (16 Jan)
The overall trend is positive, but the trend from 2002 to 2023 (~2 decades)
is slightly negative and again positive (+0.5 DU/year) for the last 8 years.
The slopes of all these trends are very small, so don't be fooled by the
plots!
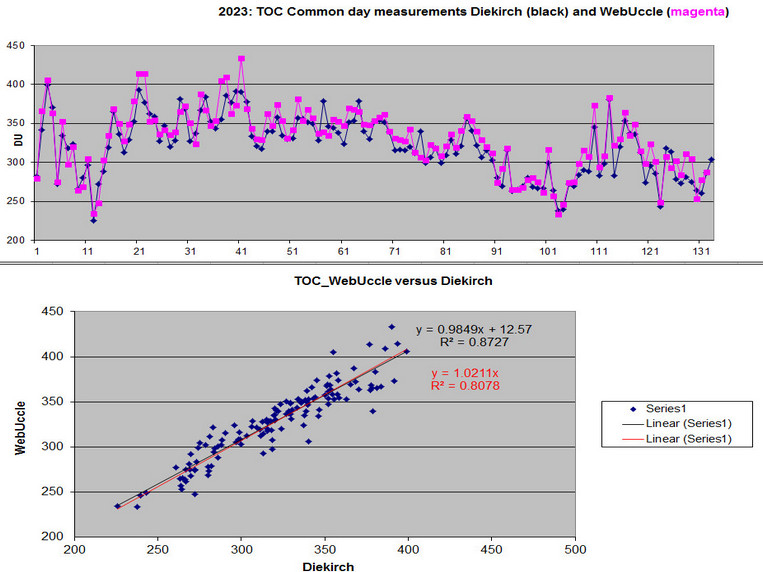
Uccle publishes its readings on the
KNMI website (here called WebUccle), where the measuring conditions
(Direct Sun as in Diekirch, or Zenith Sky or a mixture of these) are
unknown. The second plot shows the common days for Diekirch and WebUccle,
and the calibration curve based on these readings.
According to the WebUccle readings, the Diekirch values should be
multiplied by 1.02 (i.e. they globally are 2% low).
The synchronicity is excellent, as is the goodness of the fit R2=0.81).
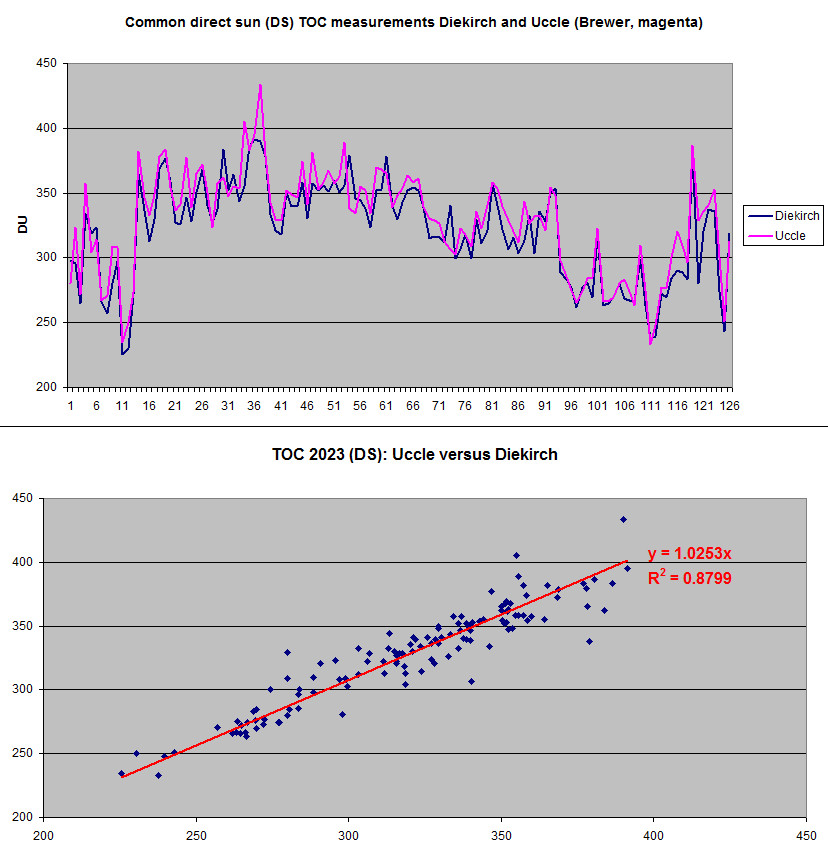
The next two plots show the comparison with the Uccle
readings made by the Brewer instruments, direct sun orientation, as
published on the WOUDC. Only the data from Jan to Nov were available (8 Feb
2024); there are 126 common days available (click for larger picture).
Averages and stdev of these common days::
Diekirch
: 319.9 +/- 37.1
Uccle
: 328.2 +/- 38.8
The calibration factor is practically the same as given by the comparison
with the WebUccle data: 1.025 (i.e. the meteoLCD data should be multiplied
by 1.025).
Uccle has a slight positive trend of +3.6 DU/decade for the 1998-2019 period, and a similar of +3.9 DU/decade from 2010 to 2019.(see also [16])
Once more, this year measurements show how good the
Microtops II instrument is compared to the enormously more expensive
Brewers!
See [4] [8]
([8] shows strong
positive trend starting 1990 for
latitudes 45°-75° North, Europe): [27] give +1.32
DU/y at the Jungfraujoch for 1995-2004.
See also recent EGU2009 poster [16].
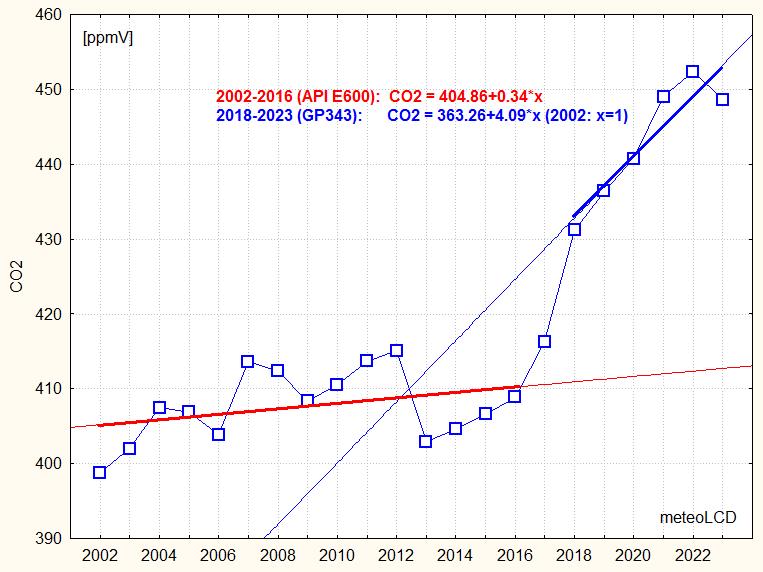
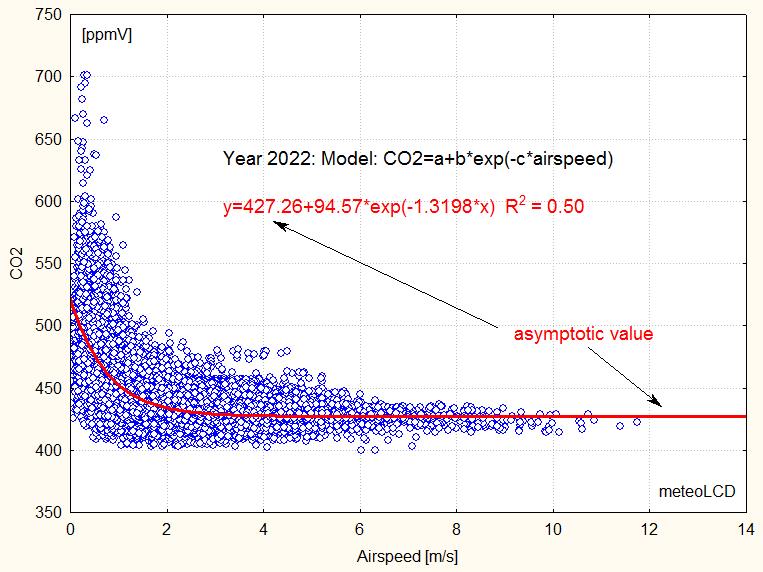
Attention: The instrument for measuring CO2 (API Teledyne E600) has been replaced by a Vaisala GMP343 sensor the 27 Jun 2017. The jump from 2017 to 2018 seems implausible high, so a zero bias should be considered possible!
Mean and stdev
of the year 2023: 441.95 +/- 8.76 ppmV
(yearly average of the Airvisual Pro CO2 sensor = 428.2 ppmV)
Yearly CO2 means:
| Diekirch (Luxembourg) |
448.6 |
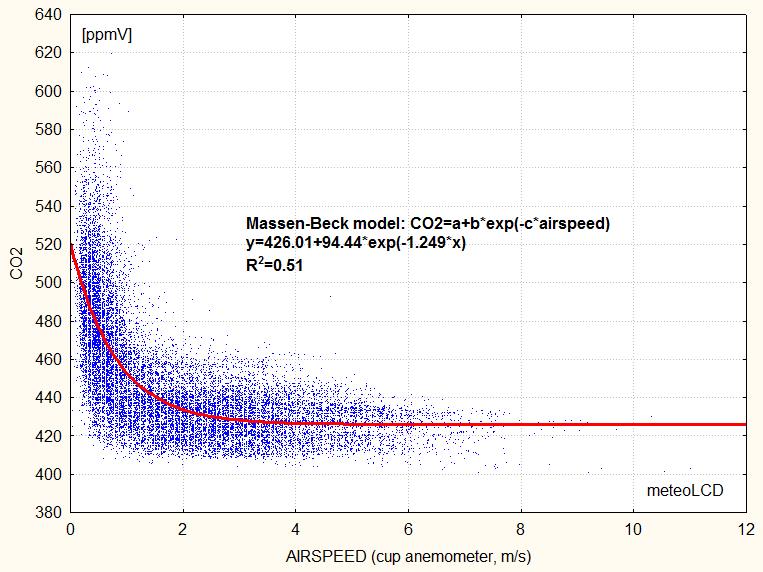
| Diekirch Massen-Beck model: | 426.0 |
| Hohenpeissenberg (Germany): | 423.9 |
| Mauna Loa (Hawaii, adjusted): |
421.1 |
The 1998-2001 data are too unreliable to be retained
for the trend analysis.
The sharp plunge in 2013 should be taken with caution;
there also was a change in the calibration gas the 21 Jan. 2014.
The second picture zooms on the last 6 years, and
gives the readings of Diekirch (DIK), Mauna Loa (MLO)
and Hohenpeissenberg (HPB) from 2018 to 2023; . Note the very
different elevations! Mauna Loa has no vegetation at all, Diekirch and HPB
similar grass and forests. Mauna Loa's readings have been adjusting for
latitude, by adding + 1.8 ppmV
The yearly trends are for this period are
| Diekirch 219m asl semi-rural |
+4.09 (Vaisala GPM343) ppmV/year | |
| Manua Loa (MLO) 3397m asl, no vegetation |
+ 2.48 ppmV/year | [34] [57] |
Hohenpeissenberg (HPB) 977m asl, forests |
+ 2.80 ppmV/year | [48] [57] [63] |
Be careful with the Vaisala readings, as the Vaisala GPM343 might not give the same accuracy as the former API! These readings also are given for local atm. pressure and non-dried air!
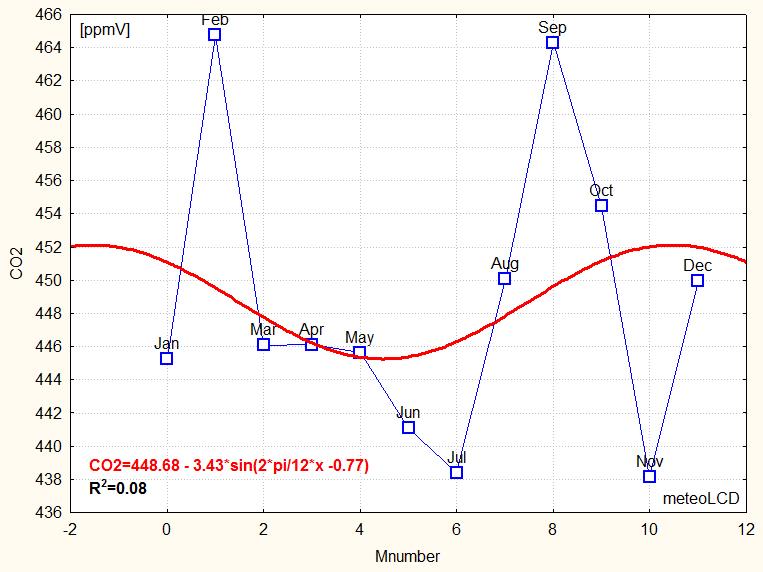
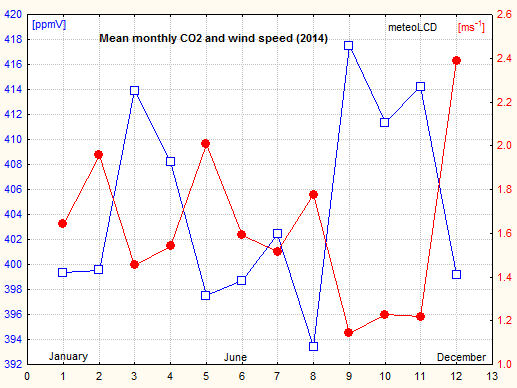
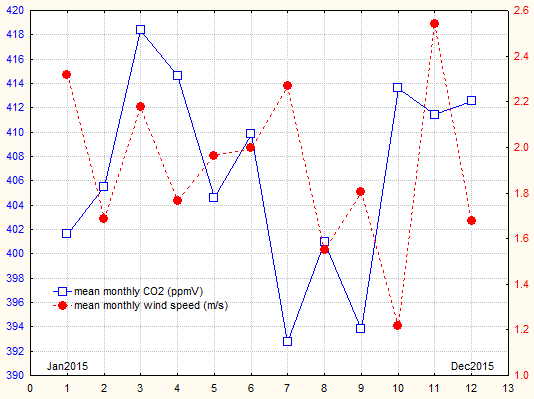
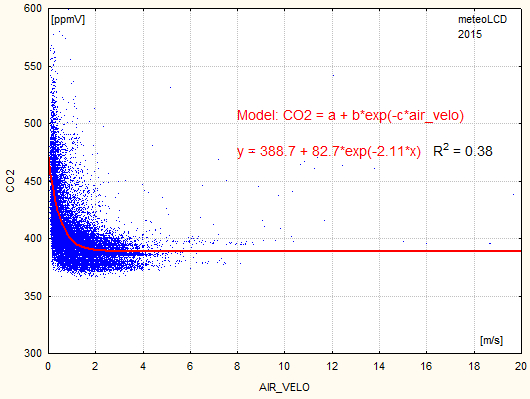
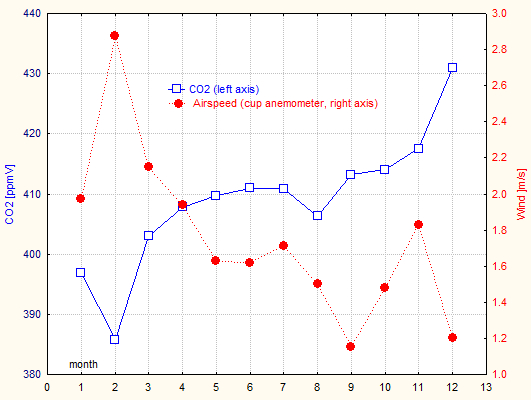
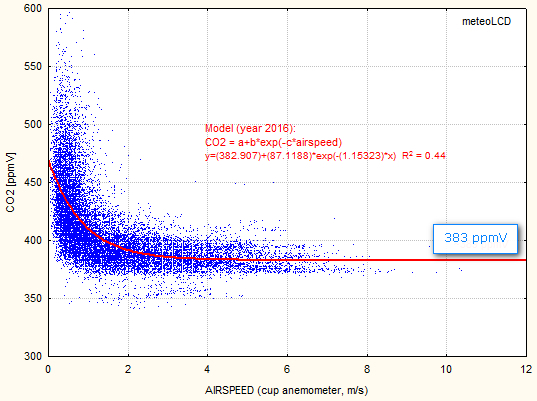
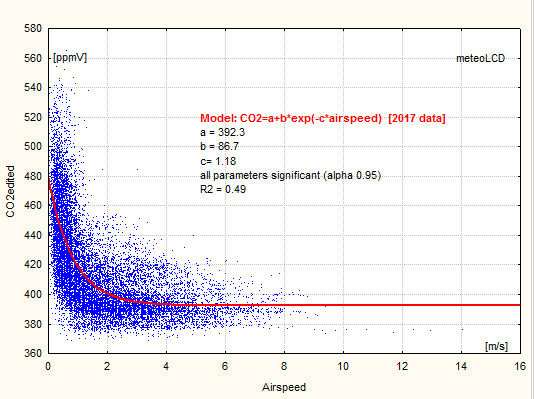
The CO2 data (monthly averages) show the summer-time lows, which reflect the impact of variable seasonal photo-synthesis (see here). A simple 12 month periodic sinus pattern was also found in 2014, 2015, 2021. Actually, as shown in addendum 3, the CO2 lowering intensity of wind speed seems to be an important modifier of this pattern, possibly masking the effect (or better: the non-effect) of photosynthesis. This happened in 2016 and 2017.
This year 2023 the yearly amplitude of the sinus fit is
3.4 ppmV (a total swing of ~6.8 ppmV, but the sinus-model applies poorly
this year [48]).
The R2 is very low, but the
summer minimum clearly stands out.
Note the large difference between the maximum September and minimum July readings!
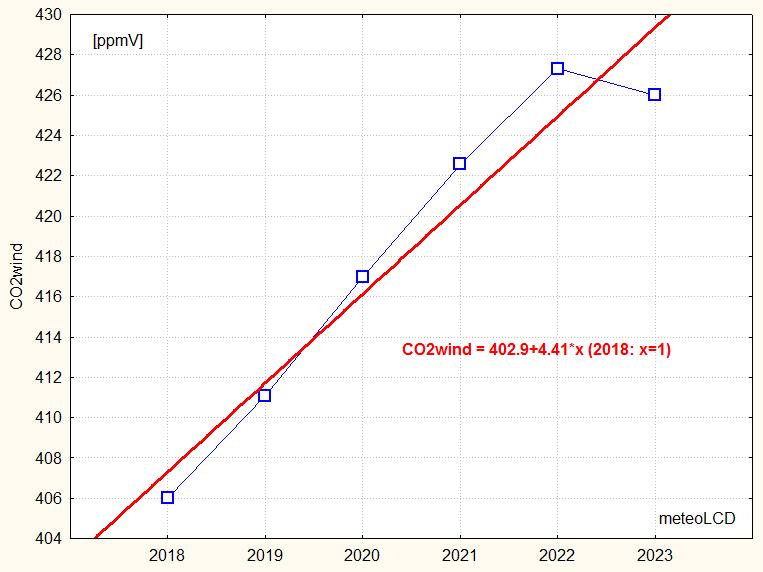
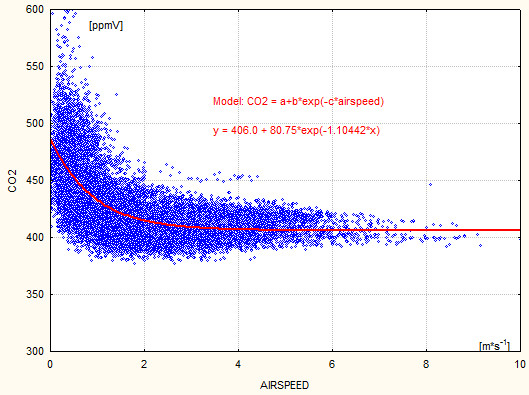
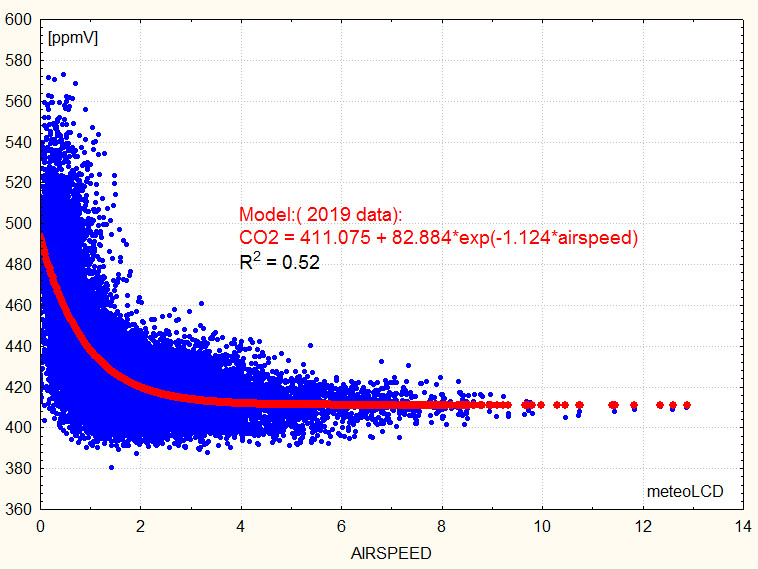
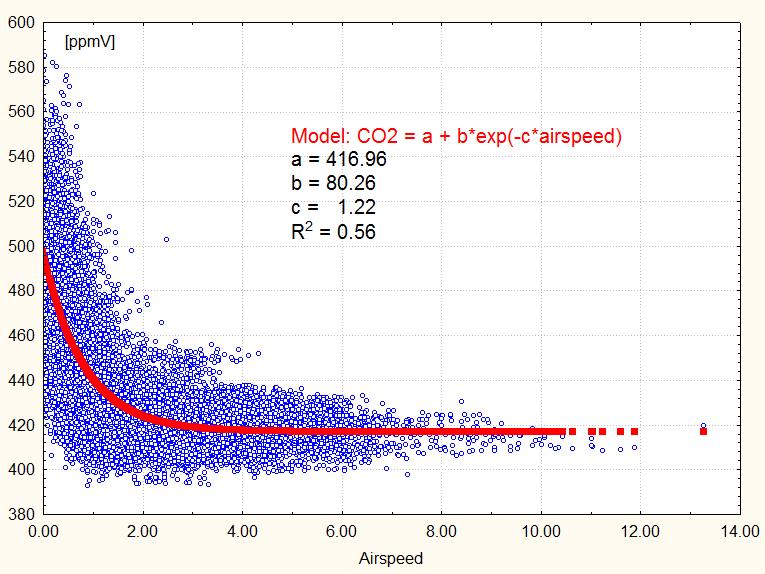
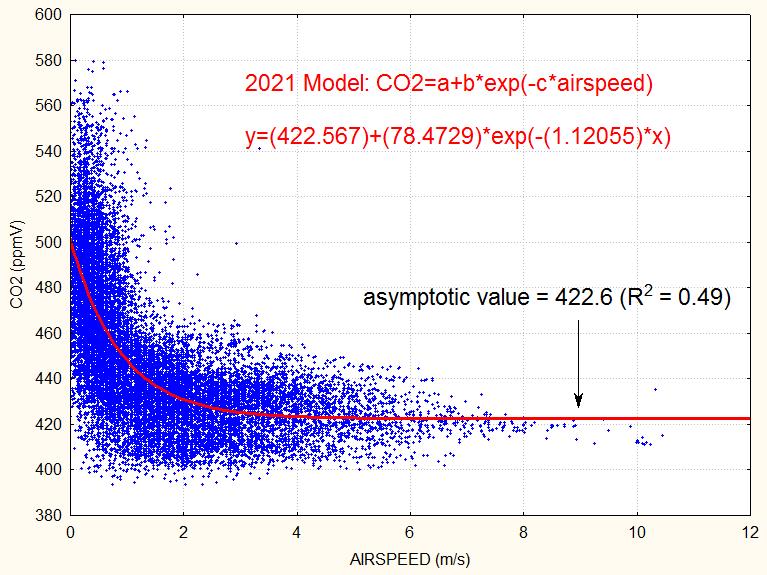
Asymptotic CO2 mixing ratio (Massen-Beck model)
Addendum 3 describes our model to calculate an asymptotic CO2 mixing ratio (airspeed by cup anemometer). The plot shows how these values vary since 2018 (Vaisala sensor), suggesting a yearly increase of 4.4 ppmV since 2018 (practically the same as given by the normal readings ).
 .
.

Attention: the change of
temperature Pt100 sensor introduced a bias of +1.61, apparent since the 2017
series, and
visible when comparing the airtemp with dry bulb temperature readings.
The yearly average airtemp readings (as given in the data files like
2022_only.xls) have been corrected by
subtracting this bias starting 2017!
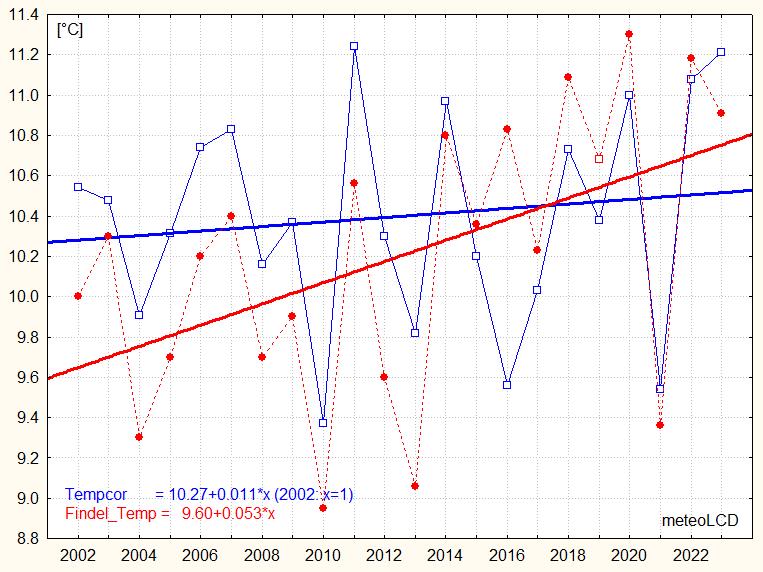
Mean of the year 2023
(from monthly averages):
Diekirch: 11.21 (corrected for bias)
Findel: 10.91
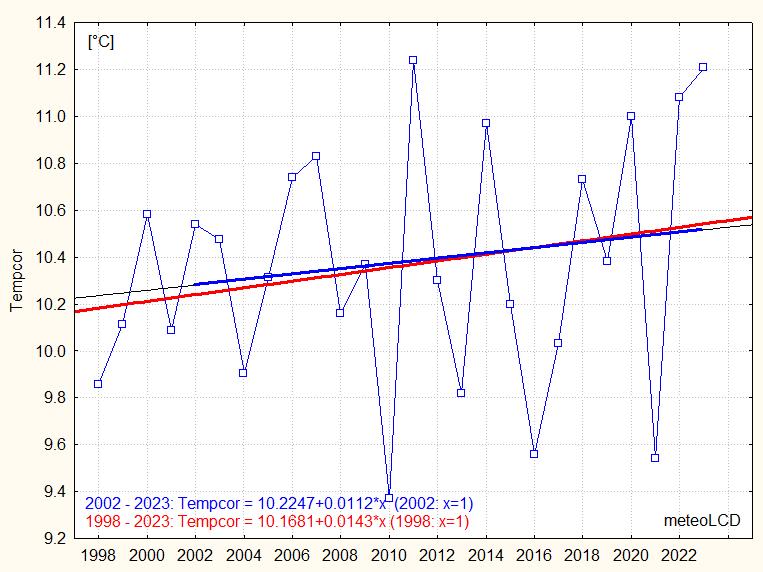
Mean Diekirch temperatures (+/- stdev) from yearly averages:
1998 to 2023 :
10.36 +/- 0.52 °C (corrected
for bias)
2002 to 2023 : 10.40 +/- 0.55 °C
(corrected for bias)
The
sensor location has not been moved since 2002! Sensor is a PT100
(see comments in
2015_only.xls); new 4-20mA
amplifier (with calibration) installed the 4th May 2016.
Trends from 2002 to 2022 (be aware that 2018 was a very strong El Nino
year!), see 2nd plot:
meteoLCD: +0.011 °C/year
(0.11 °C/decade)
(corrected for bias)
Findel: +0.053
°C/year (0.53 °C/decade)
Note the
sharp cooling in 2021 and the warming in 2022 and 2023.
Latest Global temperature anomaly trends for same period 2002-2022
(base:1991 - 2020):
UAH (satellite, LTT): + 0.23°C/decade
(NH)
[62]
Highest decadal Central England warming trend from 1691 to 2009:
+1.86°C/decade for 1694-1703!
See also
[15] (which may be obsolete)
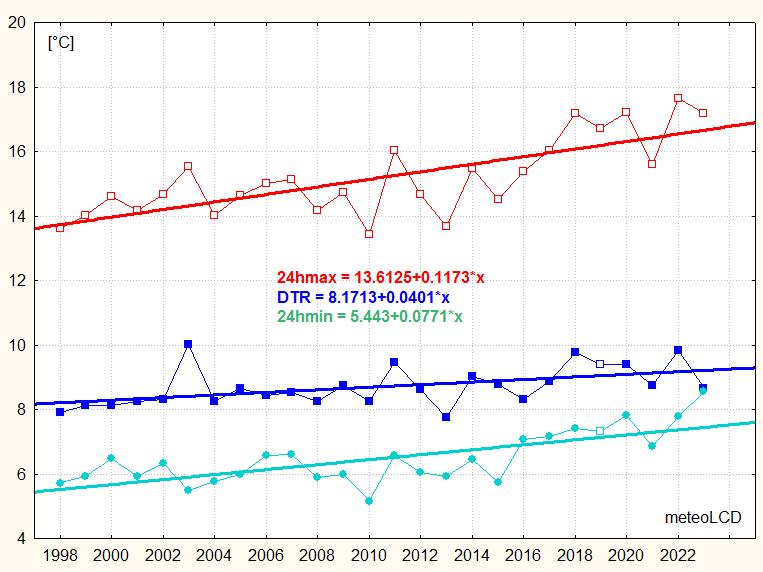
Range (DTR) [°C]
DTR = daily max - daily min temperature
Mean and stdev of the year 2023 (from monthly
averages):
Diekirch: 8.64 +/- 3.46
Findel: 7.79 +/- 2.83
Mean DTR at Diekirch &
Findel::
1998 to 2023: 8.71
& 7.71
2002 to 2022: 8.82 & 7.76
For 1998 to 2023: all trends are positive, the
24hmin
trend is lower than the 24hmax trend.
A fingerprint of anthropogenic climate warming is that daily minima increase more
rapidly than
daily maxima
so that the DTR trend should become negative. This
fingerprint does not exist here (and neither at the Findel station, see 2nd
plot).
The BEST observational data set for Luxembourg [29] stops at 2013. For our latitude of 50° North, BEST shows a positive DTR trend for the period 1988 to 2011, whereas theCMIP5 multi-model mean gives a similar but negative trend... so much for the concordance between climate models and observations!

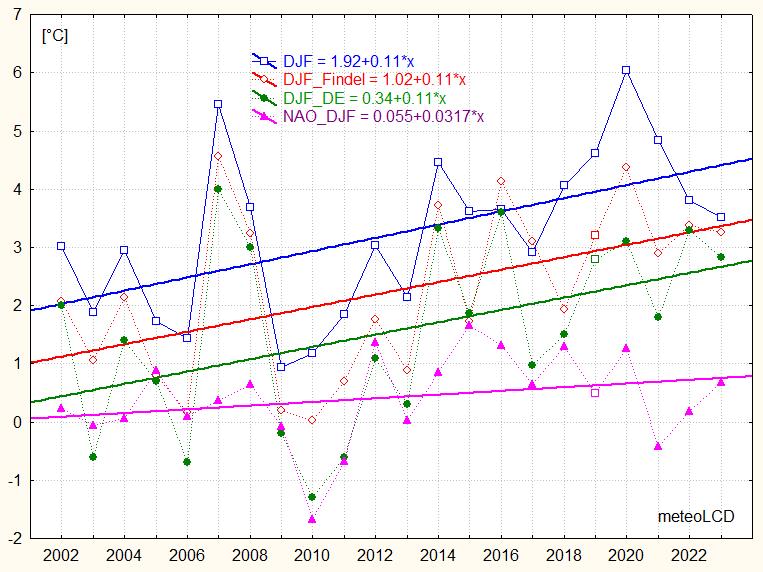
Values of winter DJF temperature of the year 2023:
(Dec2022, Jan & Feb2023), all corrected for bias
Diekirch: 3.52
Findel: 3.27
DE: 2.83 (avg. Germany)
NAO: 0.64 NAO normalized index [47]
The trends show warming winters since 2002 to 2022, with the warming probably caused by the NAO; the cooling for winter 2021 and warming for following winter 2022 seems to confirm this.
Trends from 2002 to 2023:
(2016 was a very strong El Nino year!):
Diekirch: +0.11 °C/year
Findel: +0.11
Germany: +0.11 [46]
NAO: +0.03
The plot shows the mean temperatures from
December (of previous year) to February. It also shows in
magenta the NAO index for the months Dec to Feb (right y-axis)
The North Atlantic Oscillation clearly influences
our winters (but note the exception for 2015, 2019 and 2023 !
[51]).
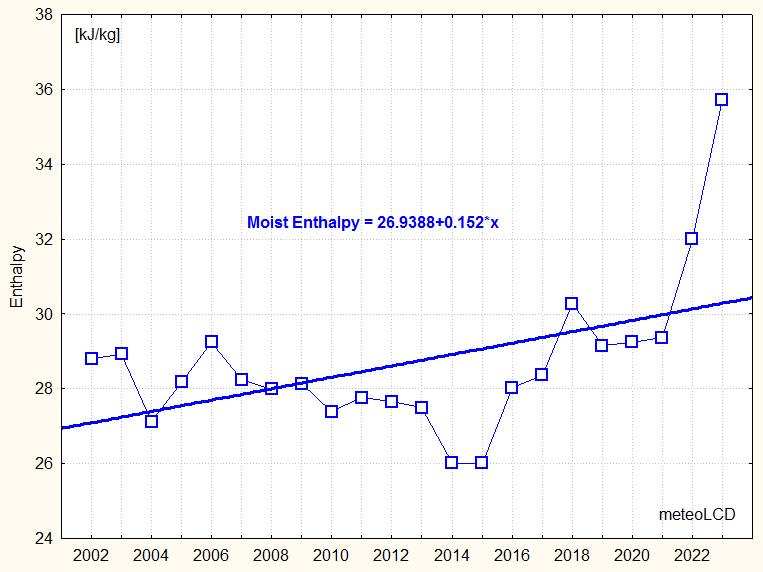
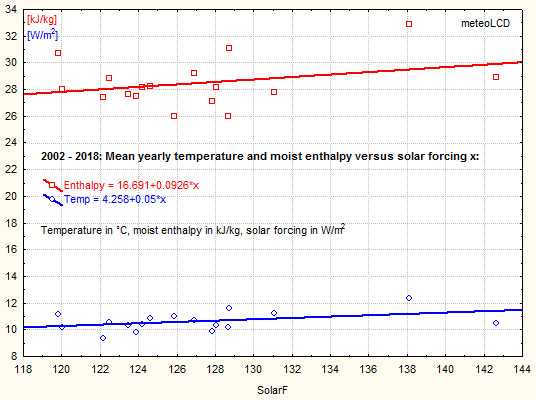
Mean moist enthalpy of 2023: 35.72 +/- 14.94 kJ/kg
See [24] on how the energy content of moist air is
calculated. Several authors, (e.g. Prof. Roger Pielke Sr.) insist that air
temperature is a poor metric for global warming/cooling, and that the energy
content of the moist air and/or the Ocean Heat Content (OHC) are better
metrics.
Mean yearly moist enthalpy values are mostly very close, but they may change from
zero up to 60 KJ/kg during a year. Moist enthalpy can not be
calculated for temperatures <= 0 °C.
mean +/- stdev from 2002 to 2022: 28.69 +/- 2.05 kJ/kg
The linear trend is distinctly positive from 2002 to 2023: +0.152
(kJ/Kg)*year-1
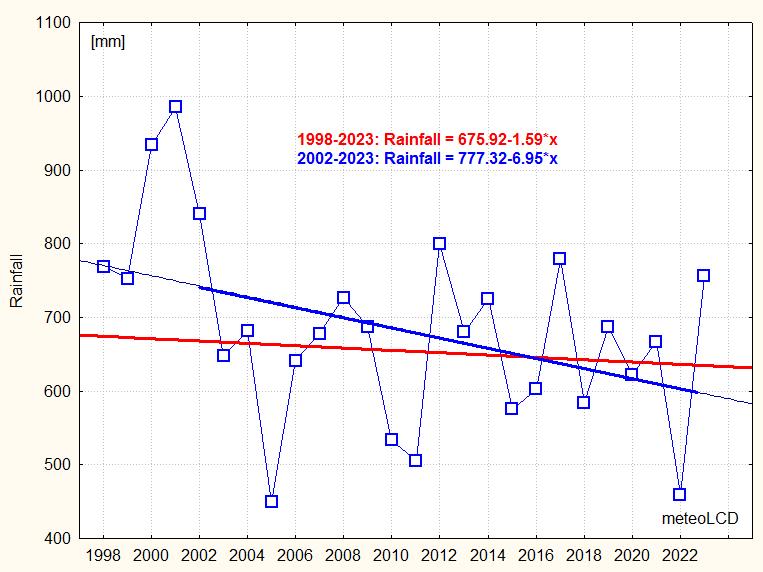
Values of rainfall (precipitation) of the year 2023:
Diekirch: 755.8 mm
Findel: 887.0 mm
Diekirch & Findel mean +/-stdev:
1998 - 2023: 683.4 +/- 129.0 mm (no Findel data)
2002 - 2023: 651.3 +/- 104.1 mm & 820.2 +/- 117.9
Linear trends:
1998 to 2023: -1.59 mm/year
2002 to 2023: -6.95 mm/year
2003 to 2023: +0.87 mm/year (plot not shown)
Choosing your starting point, you can find anything!
Note that the very dry year 2022 is similar to 2005 !
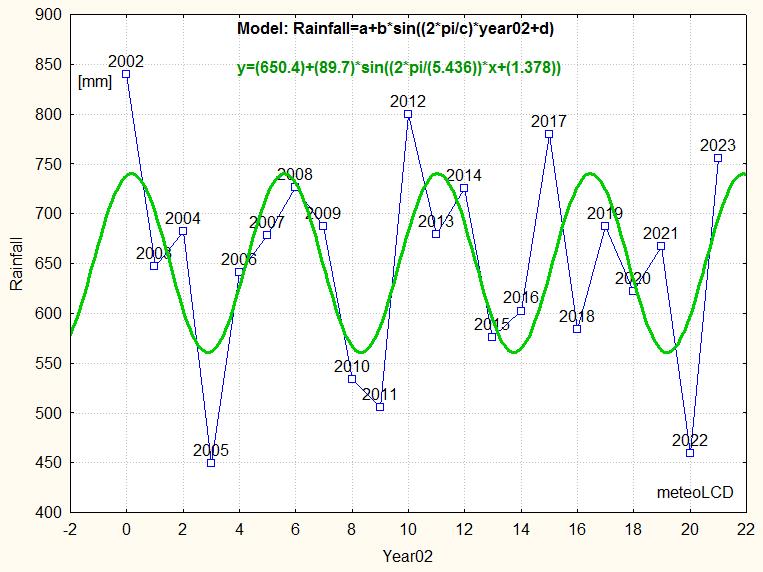
Clearly precipitation shows an oscillation pattern, so linear trends should be taken with precaution (or simply seen as nonsense).
A good model for the Diekirch data is a
sinus function: the calculation
(Levenberg-Marquart algorithm)
suggests for the interval 2002 - 2023 a 5.44 years period (~65 months, R2 =
0.39); in the model x = 0 corresponds to 2002), with a mean value of
650 mm and an
amplitude of ~90 mm; the phase shift of 1.4 rad is close to 1/2 period. All
these values are similar to those of the preceding year. All 4
parameters are significant at the alpha = 0.95 level!
[6] gives short term periods of 6 to 7 years for
the Western European region.
The oscillatory rainfall pattern is a good example how foolish it is to apply linear regressions to data when these are harmonic, something the media, activist groups and many politicians often do without much thinking.
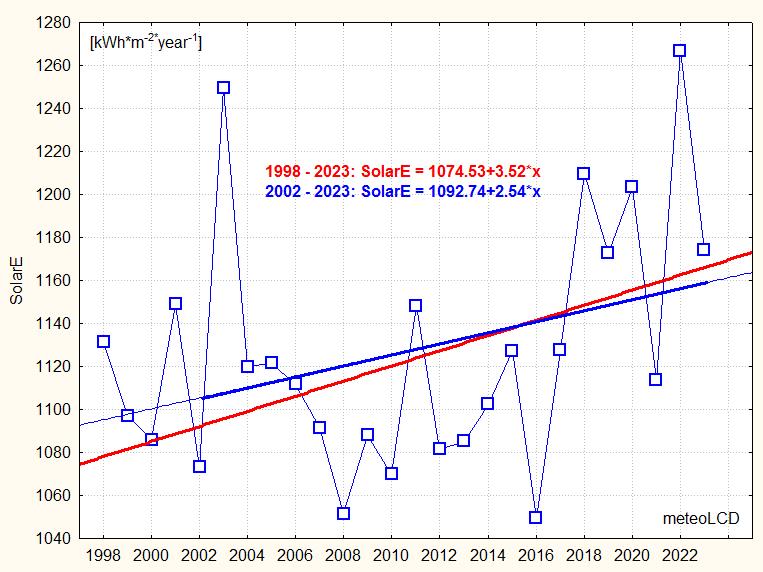
Values of total solar energy of
the year 2023:
Diekirch: 1174.1 KWh/m2
(was 1266.8 in 2022)
1998 to 2023 mean +/- stdev: 1127.0 +/- 56.8 kWh*m-2*y-1
2002 to 2023 mean +/- stdev: 1129.0 +/- 60.7 kWh*m-2*y-1
Trend from 1998 to 2023 is small, but clearly positive. [52]
(see
Addendum 1 for calculations of radiative
forcing and solar sensitivity, addendum 2 for
detecting a solar influence on temperature and moist enthalpy)
Helioclim satellite measurements show ongoing solar dimming over
Luxembourg for 1985 to 2005 [33] (see
graph)
[14] finds 0.7 Wm-2y-1
for West-Europe 1994-2003 , meteoLCD +1 Wm-2y-1 for
1998-2003.See also [9]
(meteoLCD values derived from pyranometer data by Olivieri's method)
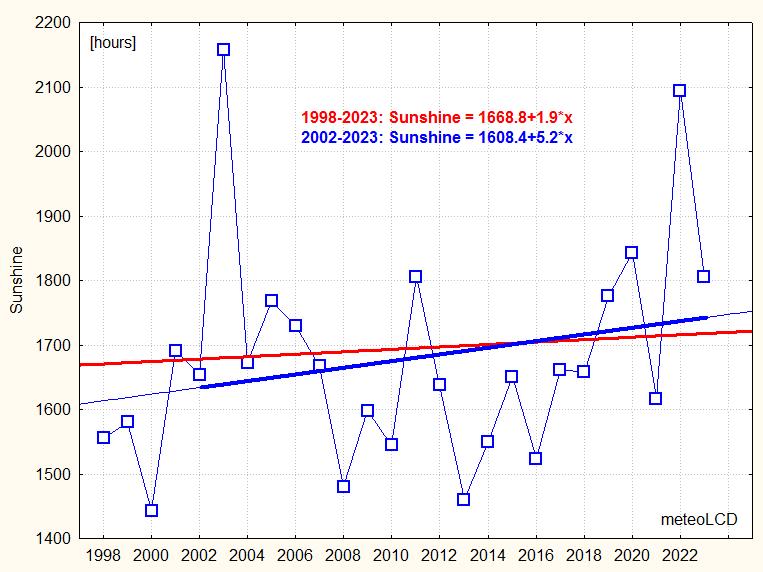
Values of sunshine hours of the year 2023:
Diekirch: 1805 hours (215m asl)
(from pyranometer)
Findel: 1910 hours
(365m asl, (from Campbell- Stokes?, known to measure in excess)
Trier:
1815 hours (279m asl)
[40]
[53]
(Petrisberg)
Maastricht: 1837 hours (114m asl)
[53]
Trends:
1998 to 2023: +19 hours/decade
2002 to 2023: +52 hours/decade !
Note the recent sharp declines in 2021 and 2023.
See paper
[23] by F. Massen
comparing 4 different methods to compute sunshine duration from pyranometer
The 2nd graph shows the plots of the four above-mentioned stations. It should be noted that meteoLCD (Diekirch) is located in a valley, Trier and Findel & Maastricht airports on top of a plateau. The Findel totals are much higher than those of the other stations, which certainly is also partially caused by the use of the Campbell-Stokes instrument known to give too high readings.
All 4 stations give totals that practically always vary in the same manner (synchronous increase and decrease).
The trends of all 4 stations are positive since 1998 and similar, except Diekirch being lower
All stations show distinct decline in sunshine hours in 2021, and a 2022 maximum close to that of 2003.
These positive trends from 1998 on probably suffice to explain the warming since 1998.
The correlations between mean temperature are yearly sunshine hours are positive for the 4 stations, and these correlations are statistically significant at the alpha = 0.95 level for all stations:
Diekirch: 0.48, Findel 0.60, Trier 0.58, Maastricht 0.49

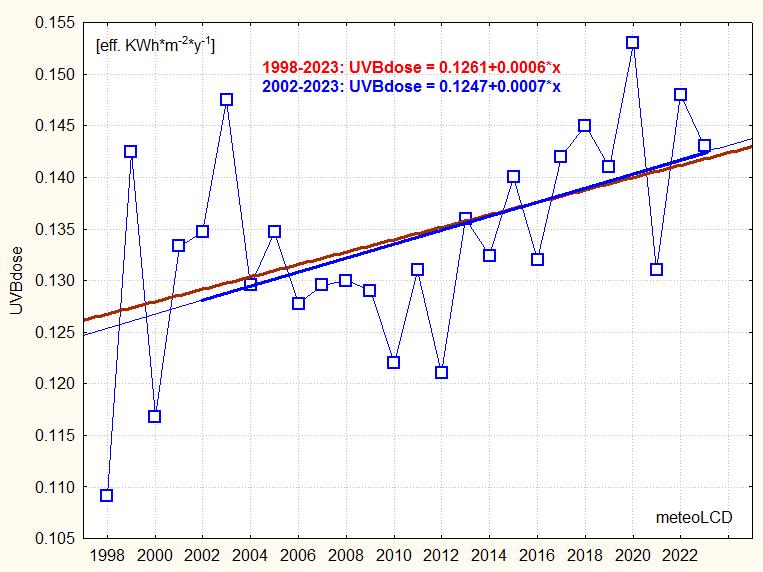
Erythemal UVB dose of the year 2023: 0.143 eff. kWh/m2
mean +/- stdev:
1998 to 2023: 0.134 +/- 0.010 eff. kWh*m-2y-1
2002 to 2023: 0.135 +/- 0.008
The trend over
1998 - 2023 is positive, in concordance with solar irradiance and sunshine
hours.
.
See
[10]
and [22] (poster finds slight
positive trend in June (+2%) and negative trend in August (-1%), no trend
for other months, for period 1991 to 2008.
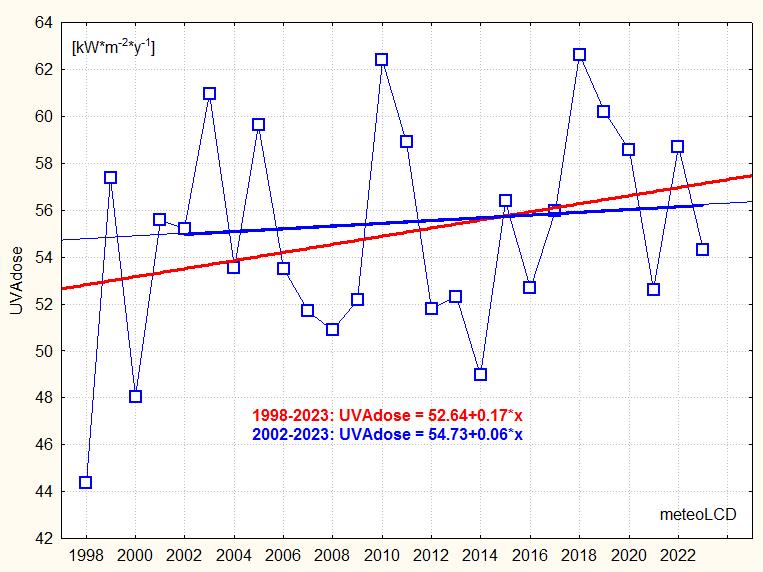
UVA dose of the year 2023: 54.3 KWh/m2
Some intermittent problems with internal temperature stabilization of the sensor; the influence seems minimal, so all readings have been kept.
mean +/- stdev:
1998 to 2023: 54.97 +/- 4.54 kWh*m-2*y-1
2002 to 2023: 55.64 +/- 4.01
The 3 independent measurements of solar energy, eff. UVB and UVA doses all point to an increase since 1998.
|
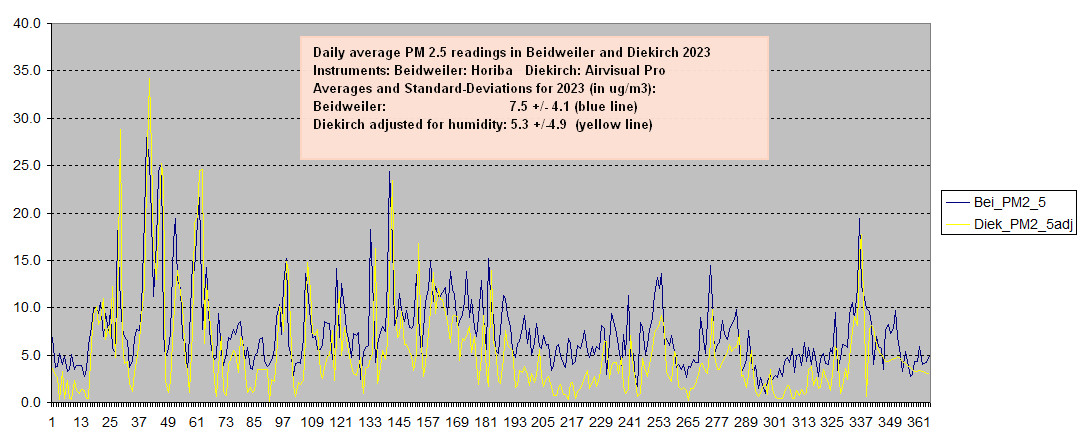
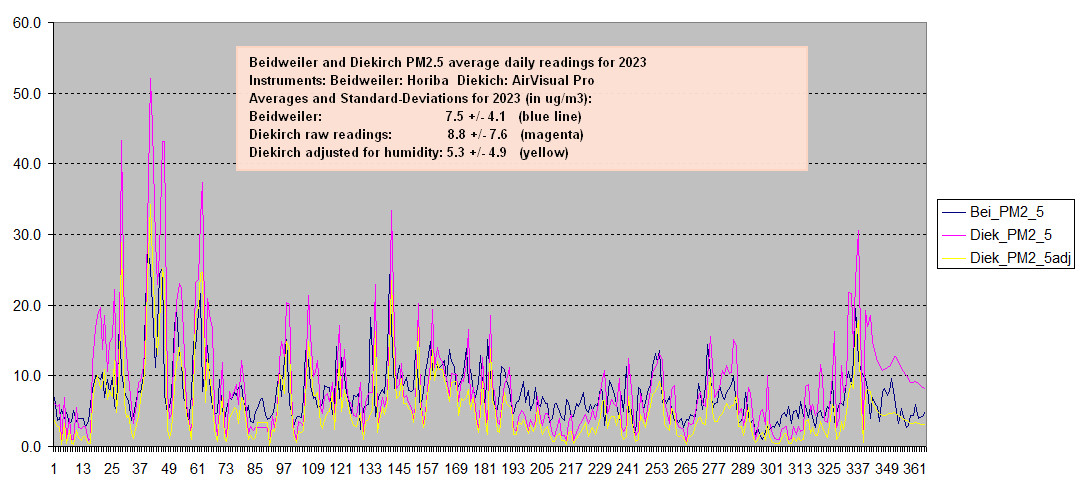
Fine particle measurements at meteoLCD Click on pictures for large view!
An Airvisual Pro sensor from iQAir has been operational for the full year since 2019. Besides temperature, humidity and CO2, this sensor also measures PM2.5 and PM10 concentrations in ug/m3. All data are stored in a cloud managed by iQAir (https://airvisual.com/luxembourg/diekirch/diekirch/meteolcd shows only the PM2.5 concentrations. The measuring principle for the PM is LLS (Laser Light Scattering). Ambient air is sucked into the measuring chamber by a small fan running continuously; there is no air drying nor correction for pressure variations. It has been found that the most important correction for this type of sensor is the humidity correction, as above 70% RH condensing water on the aerosol particles inflates the count and the reported mass. At meteoLCD we divide the raw data by a growth factor GF =a+(b*RH**2)/(1-RH) with a=1 and b = 0.25 and RH = RH%/100. Read the article "One year of fine particle measurements by Airvisual Pro at meteoLCD" on the blog meteolcd.wordpress.com [ref. 59] The next plot shows the PM2.5 readings per day. T Yearly average +/. stdev: Maximum of daily average:
The correspondence of the PM 2.5 measurements between Beidweiler and Diekirch is very satisfying, and the peak situations mostly coincide. It must be noted that Beidweiler (blue plot) has missing data; these missing data have been filled-in by repeating the last readings preceding the gap. Comparing the raw (magenta) curve with Beidweiler (blue plot), it is obvious that a correction for humidity is mandatory especially during the humid autumn, winter and spring days. The PM10 readings of the Airvisual Pro are very close (too close!) to it's PM2.5, and as such considerably different if compared to the Beidweiler readings; this same behavior has been shown by the previous Airvisual instrument.They will not be retained in this analysis. A general conclusion is that fine particles do not present any health risk at Diekirch, and are substantially lower than the annual interim target in the last WMO guidelines [61] which are 35 ug/m3 for PM2.5 (24h short term is 75) resp 70 and 45 short-term for PM10. An exceptional situation is shown by the peaks in February and December, when several houses in the close neighborhood were probably burning wood.
|
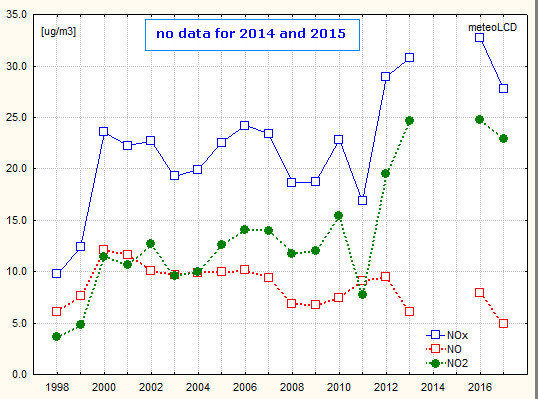
(End of measurements useable for trends in 2013. Measurements stopped in 2017).
Attention: only
78% of possible measurements available due to sensor downtime!
Comparison between yearly averages at Diekirch, Luxembourg-Liberté and
Vianden (rural)
[39]; Luxembourg and Vianden values derived by
inspection from graphs):
|
ug/m3 |
NOx | NO2 | NO | maximum of daily avg. NO2 |
| Diekirch | 28 | 23 | 5 | 62 |
| Luxembourg-Liberté | ~ 50 | ~ 82 | ||
| Vianden | ~ 10 | ~40 |
The NOx/NO measurements by the AC31M instruments from Environnement SA have
been stopped the 30 December 2017. The AC31M has reached its end of life.
see [11] which gives ~30% reduction from 1990 to 2005 for the EU-15 countries.
