![]()
2026_06_28
RAF calculation during the June heatwave days
During the period starting about the 18th June 2026, a heatwave extended over much of Western Europe, and so also over Diekirch, Luxembourg.
I used a series of blue sky days (where the Solar Zenith Angles (SZA) were very close) to redo the calculations for the Radiation Amplification Factor.
There is no written text, just an Excel file with links to two previous Blog posts in 2011 and 2013.
The RAF found is about 0.81, well in the range of 0.7 to 1.4 found in the literature.
By definition, the RAF is the slope of the regression line for the scatter plot of -ln(UVB/UVBref) versus ln(TOC/TOCref),
Here UVB is the maximum of the day; the .ref parameters here are the values of the first day (18 June) of the series.
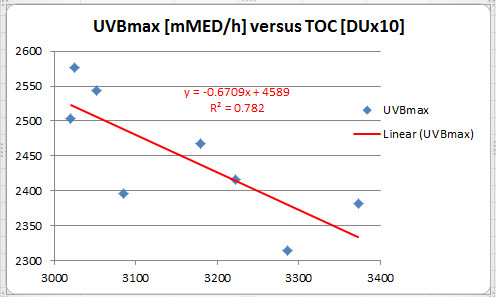
To make the plots easier to look at, I used TOCx10 (=DUx10) for the TOC readings, and mMED/h for the erythemal UVB readings.
The series of days are not optimal, as the TOC values did not change in a dramatic way. Nevertheless the plot clearly shows that maximum UVB is highest when TOC is lowest.
Click here for the Excel file ( name is TOC_UVB_June.xlsx)
_____________________________________________________________________________________________________________________________